Project 2: Create Boullion Charts averaged annually using Perl and Gnuplot
2017-09-12
Objective:
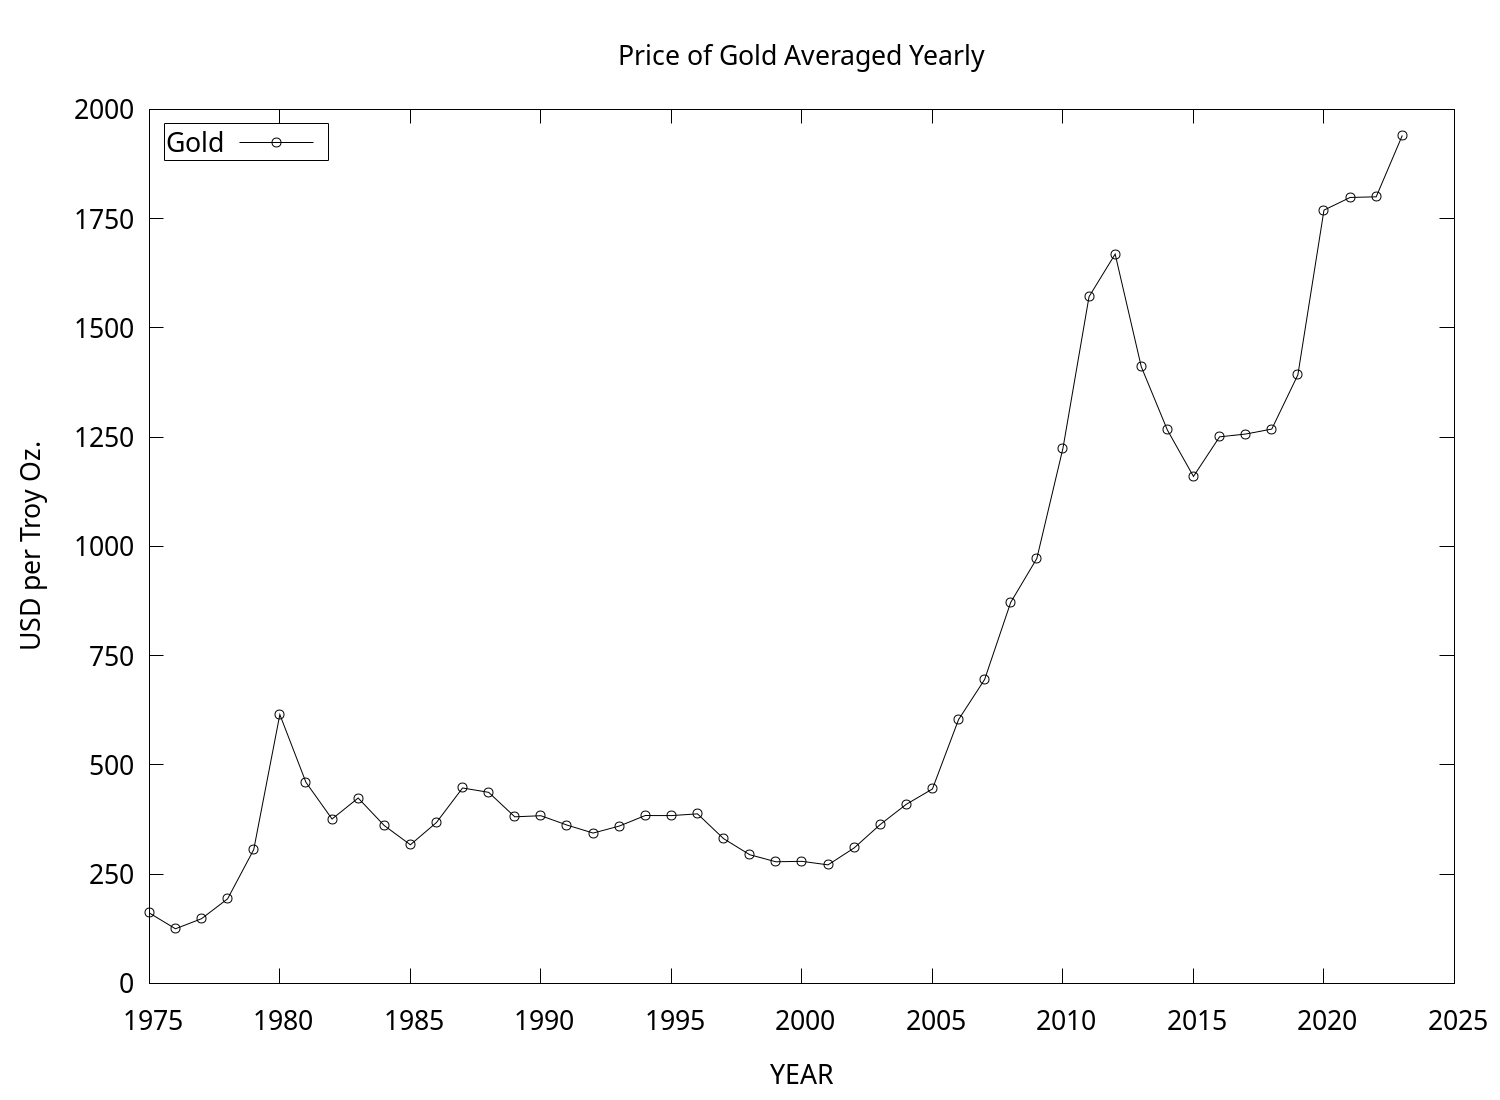
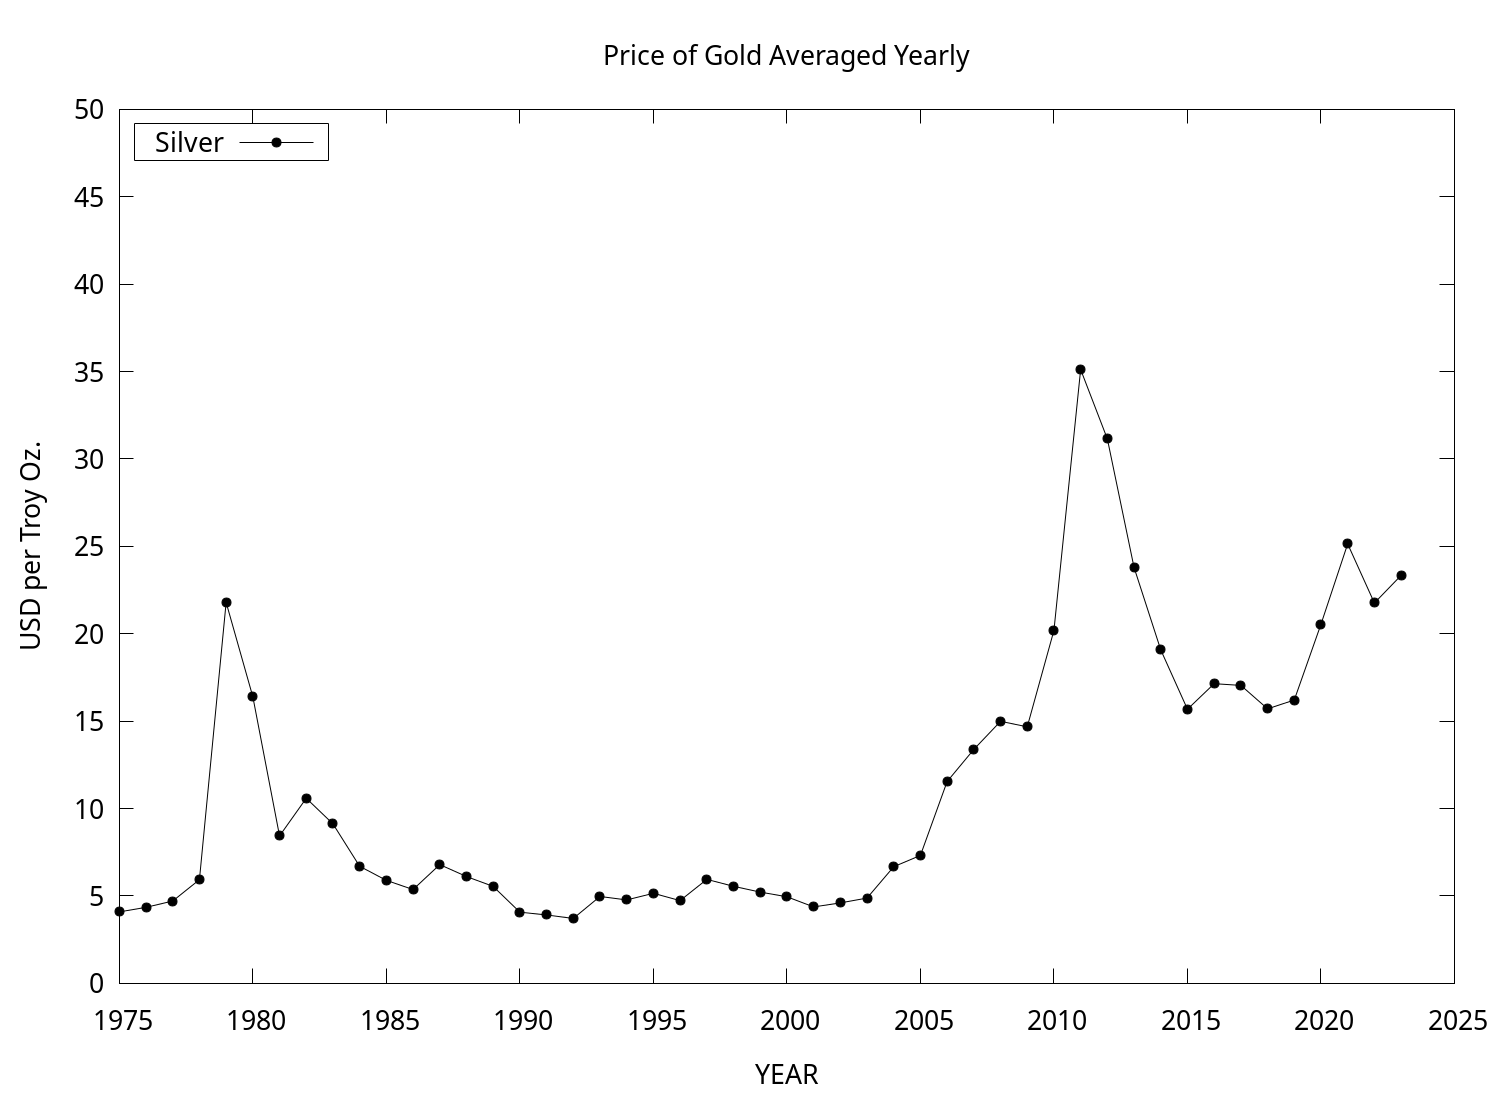
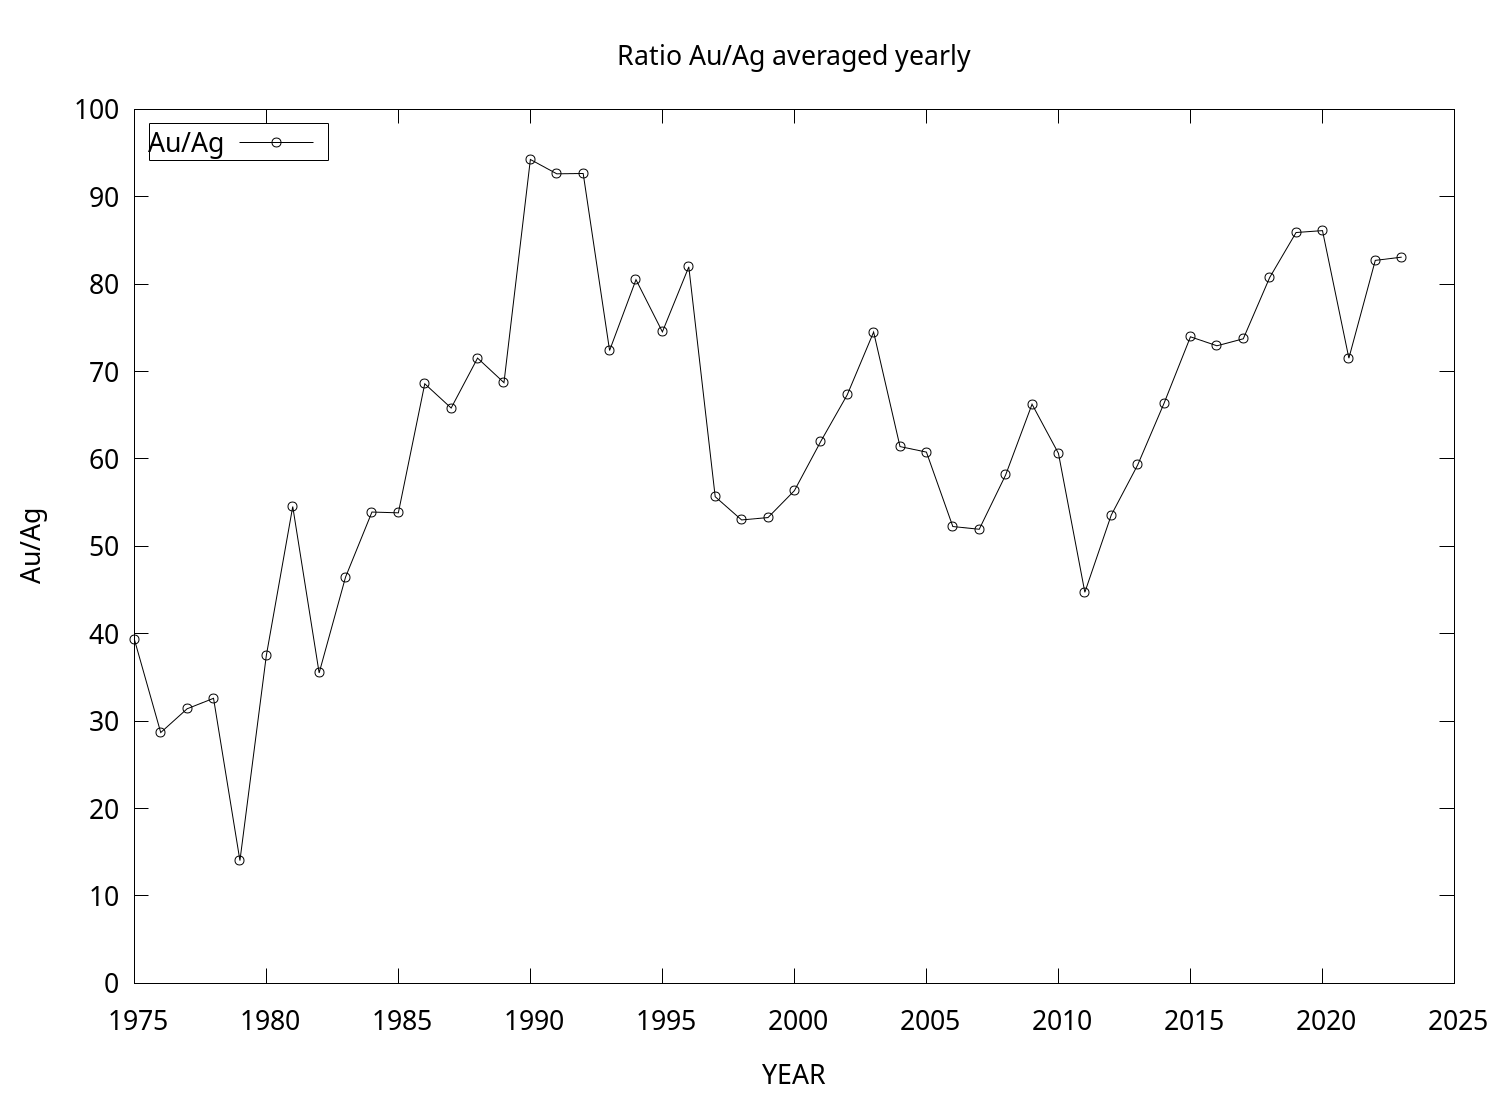
To use London Bullion Market Association (LBMA) price data to chart averaged yearly price of gold and silver. We will be using Perl and gnuplot to create the charts. Also, perl will do some basic manipulation to provide the gold-silver (AuAg) ratio. This ratio provides the relative value between gold and silver and some traders use it to decide when to buy a particular precious metal.
Materials:
1. Recommended equipment is a workstation running linux.
2. Text download of LBMA bullion prices.
Software:
1. Linux OS2. Perl 5 version 22
3. Gnuplot 5.0
Note 1: The average Au Ag ratio from 2007 to 2017-08 is 62.1. In 1980 it was 17.
Note 2: In August 15, 1971 President Richard Nixon announced that USA has ended the Bretton Woods System of fixing the dollar to gold. Effectively rendering the US dollar a fiat currency, or in otherwords, the value paper money is established by goverment law.
Perl Script:
Click here to get a copy of perl script.
Click here to get a copy of the data.
Perl Script: Explained
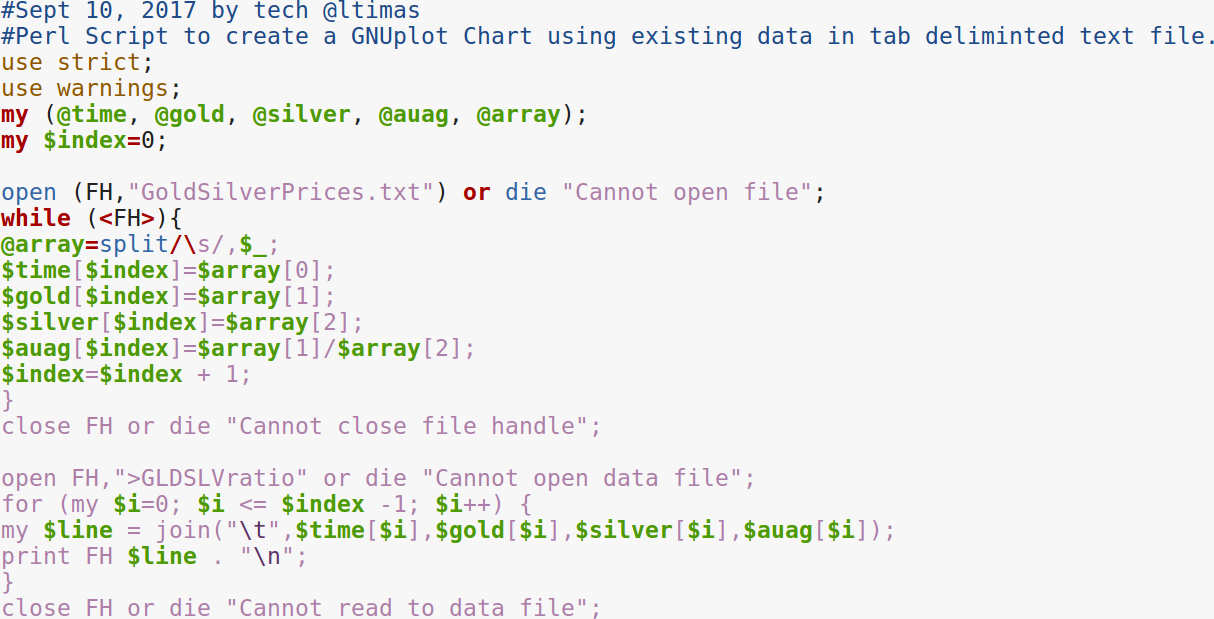
If you are novice and need some explanation you can read further.First section sets strict and warnings to help debug the script. Next two lines define variables with a global scope. In this script each column of data will be read into a one dimensional array. This could have been done using a multi-dimensional array.
The next section of code first opens a file handle to access a text file containing LBMA data. Then a while loop is run to execute each line of the data file. One line of data is read into the array as three data points using the split function. The three data points of year, yearly averaged gold price and yearly averaged silver price are saved to appropriately named arrays for later use. A fourth data point is created by taking the ratio of gold to silver. The index variable is used to keep track of array indices. Final line in this section closes the data text file handle.
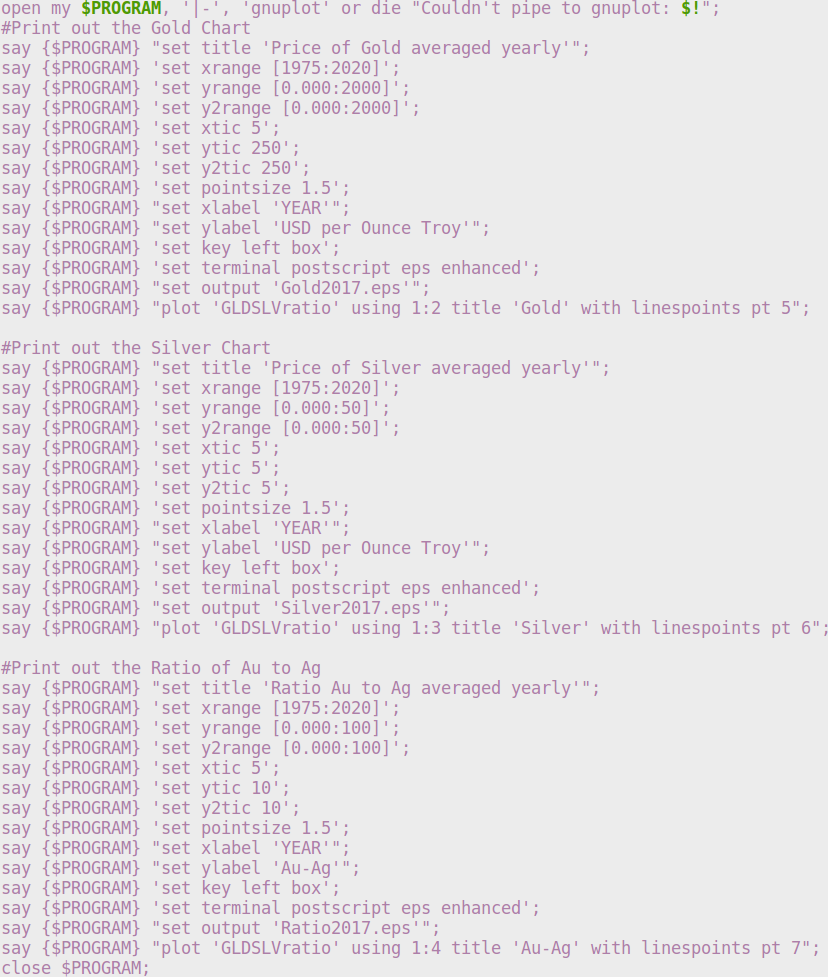
The third section of code opens a file handle to save the data. Then runs a for loop to save the data including the yearly averaged gold-silver ratio.
- Gold prices averaged yearly from 1975 to 2023,
- Silver prices average yearly from 1975 to 2023, and
- Gold-silver ratio averaged year from 1976 to 2023
Conclusion
That is it for this project.
Design credit knxops.com in cooperation with Ltimas and co.
Copyright © 2024 by Gregory Altimas aka Greg Altimas
