Project 1: Raspberry Pi with One Wire Temperature Sensor
2017-09-08
Updated: 2020-08-30
Objective:
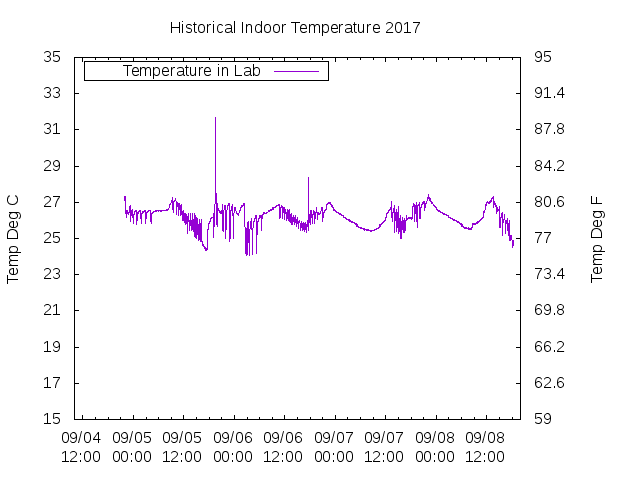
To use a Raspberry Pi and 1-wire digital thermometer to log time and temperature to a file on the Raspberry Pi SD storage. Then use the data to create a plot of temperature versus time.
Materials:
1. Raspberry Pi Model B with Raspbian OS. Prefer to use in a headless set-up but will need monitor and peripherals to set-up
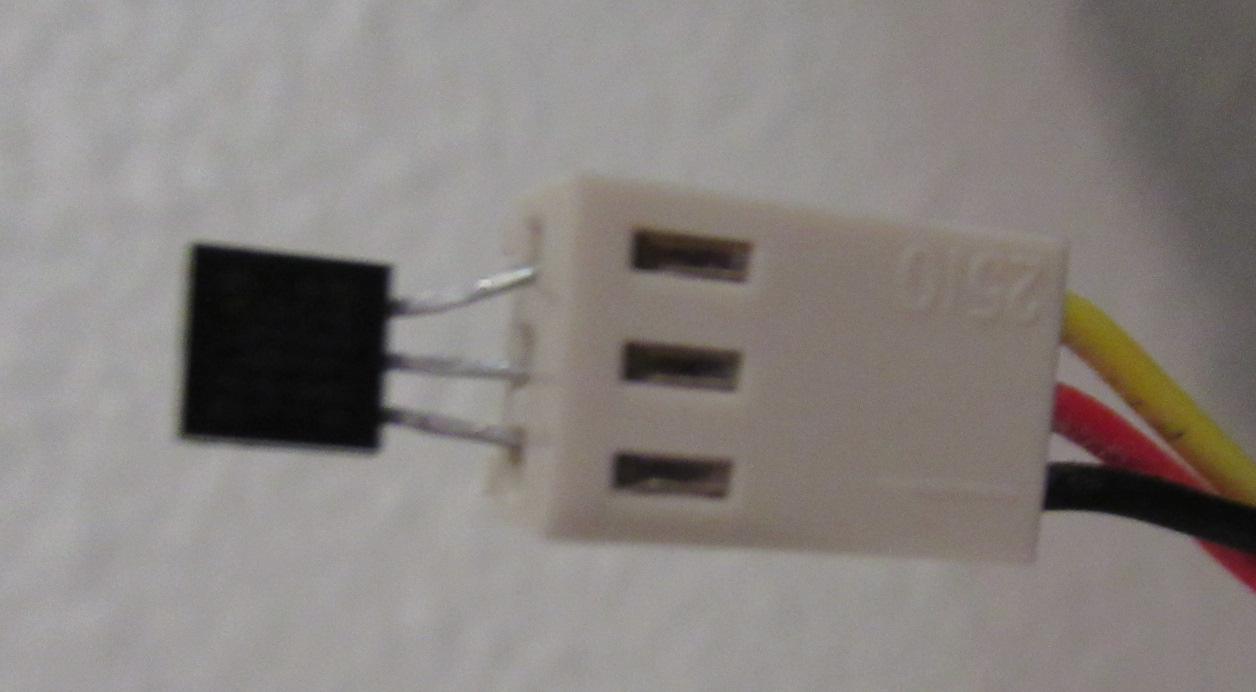
2. Maximum Integrated DS1822 Econo 1-Wire Digital Thermometer.
Click here to download the manual.
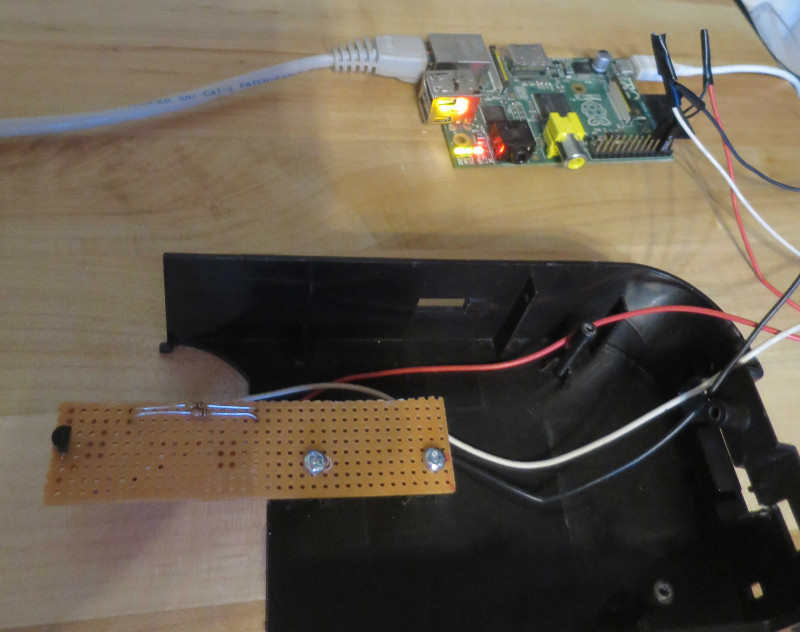
3. 4.7 kΩ resistor (in this case used two 10 kΩ resistors wired in parallel).
4. Misc wire and connectors to attach the temperature sensor to Raspbery Pi's GPIO.
5. Recommended equipment is a workstation running linux to allow headless Raspberry Pi set-up.
Software:
1. Linux OS (Raspbian for the Raspberry Pi, and a workstation version)2. Python version 2.7.3
3. Gnuplot 5.0
Hardware:
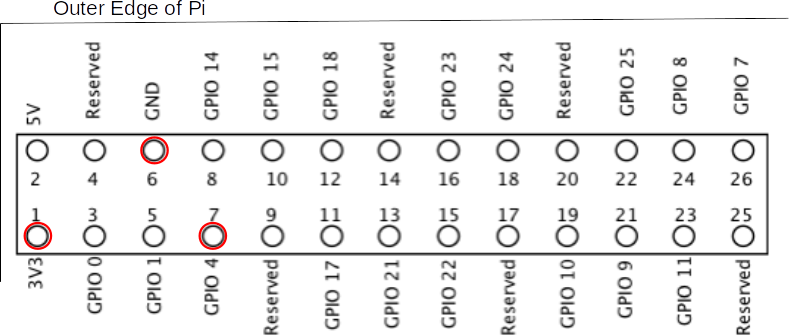
1. Solder black wire to ground and connect to Ground (pin 6).2. Solder red wire to power and connect to GPIO power (pin 1).
3. Solder white wire to data and connect to GPIO 4 (pin 7).
4. Connect pullup resistor to data and power wires.
NOTE 2: For full electronic details on the DS1822 download the maxim integrated DS1822 spec sheet. You will find the DS1822 works using a 64 bit code unique to the device. This allows multiple temp sensors to be wired into the one data pin. This sensor is used in HVAC controls, temperature monitoring systems, and industrial systems.
Software Set-Up:
You likely already have your Raspberry Pi (Raspi) running on raspbian, if not there are many sources to help get you running. The next which I will not delve into here is to set-up raspbian in a headless configuration. This means running the Raspi without user peripherals (i.e. mouse, keyboard, and monitor. This is highly recommended as it minimums the power draw for these devices and leaves the Raspi in a more stable configuration.Next get familiar with modprobe we are going to use it to add one-wire interface to the linux kernal. First SSH into the raspberry pi terminal, then:
- sudo modprobe w1-gpio
- sudo modprobe w1-therm
GRA Added correction on 2018-08-21:To test the one-wire interface and hardware set-up:Had issues with using the device tree. Got this working by using overlay, add to /boot/config.txt file:
dtoverlay=w1-gpio
sudo modprobe w1-gpio
- cd /sys/bus/w1/devices/

I quickly wrote a python script to log data to text file. The code requires the time module. It simple runs a for loop, indefinitely. This is set-up by lopping for one million cycles. After the for loop the first line of code just opens a file handle, the following 7 lines interact with the sensor and create a data point in variable named temperature. The next line writes time stamp in "2017-09-06" format, this is done for reason (gnuplot requires all time date in number format). The next 2 lines just write the data and close filehandle. An indoor temperature controlled by an HVAC system is stable so the final line waits 60 seconds using the sleep command. This set-up creates a file that records time/temp data every 60 seconds, see below for sample of data.
For a copy of the script file click here.
For a copy of the GNU plot script file click here.
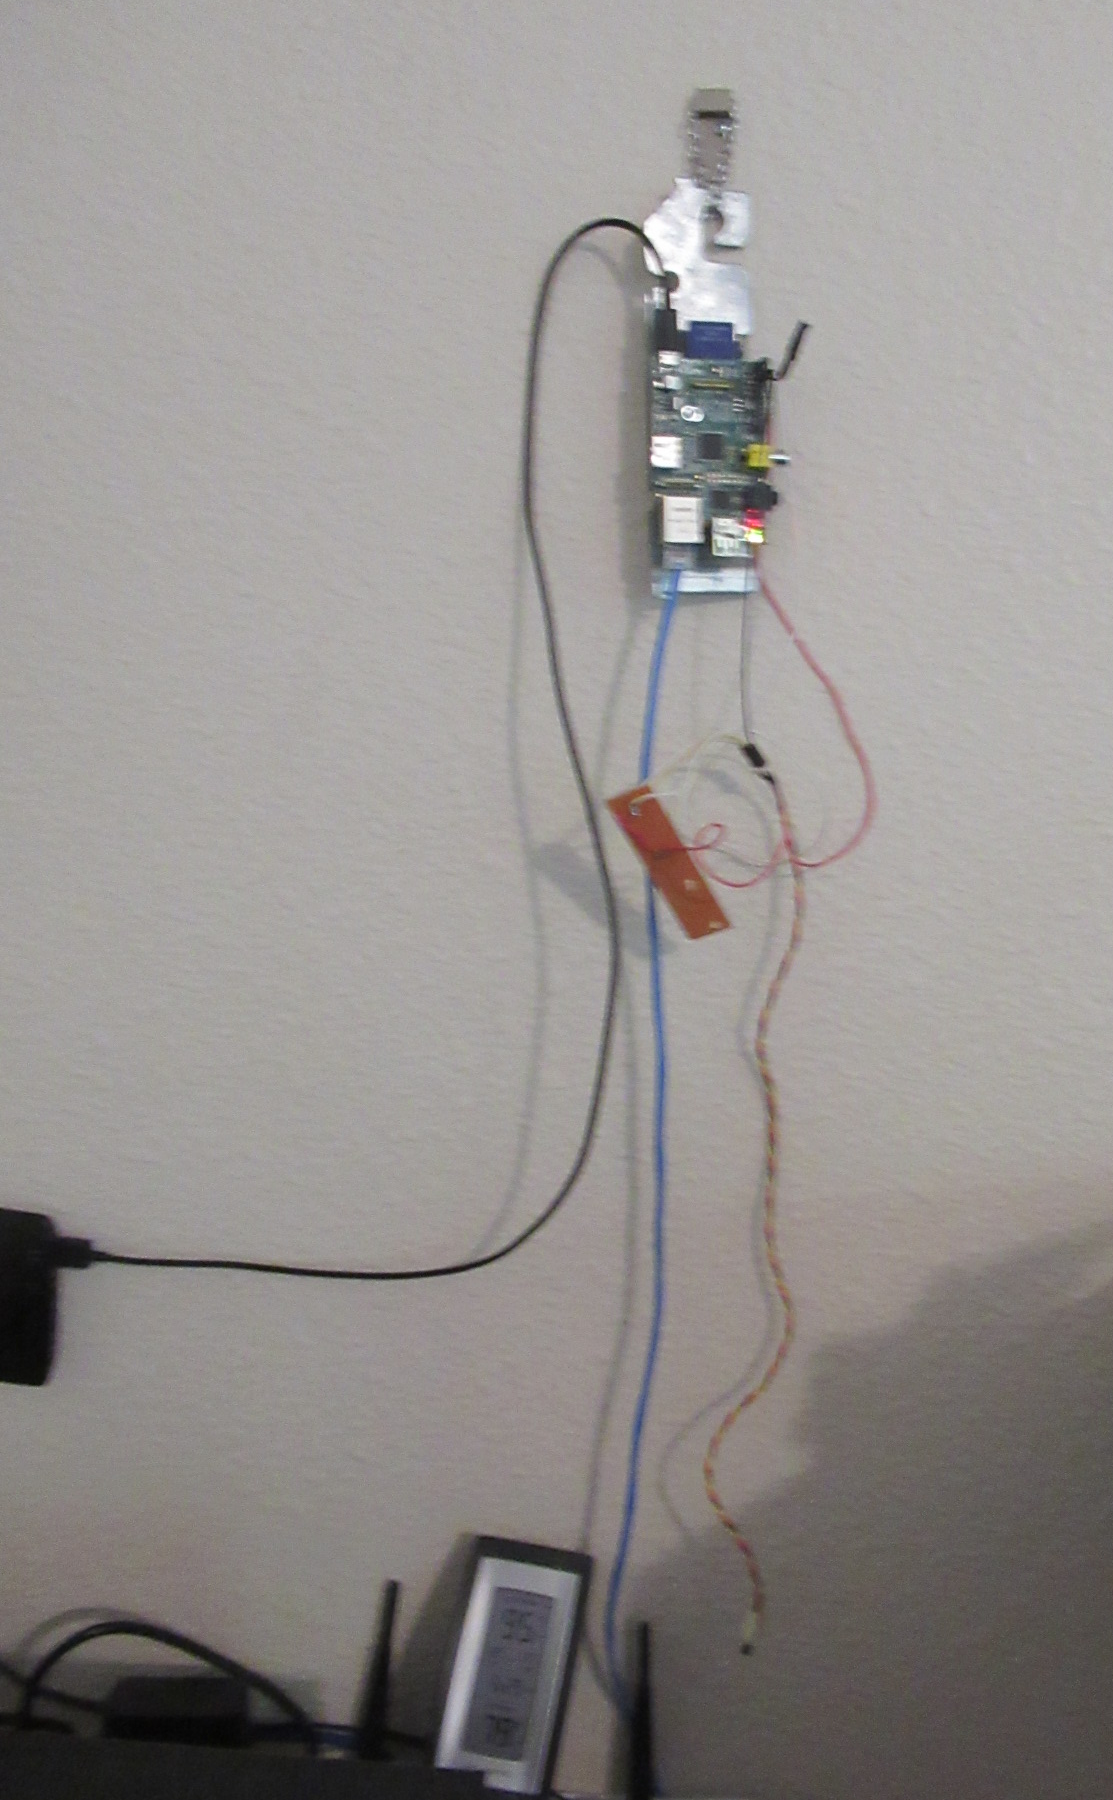
Previous set-up failed, one of the sensor legs pulled out. Created this for a replacement. Better to hang off the wall to get out of the way. Also, found it better to pay a few bucks and use a CPU fan extension connector to eliminate solder points. Conclusion
That is it for this project. You can take it from here, here are some ideas: Design credit knxops.com in cooperation with Ltimas and co.
2020 Set-up
Copyright © 2019 by Gregory Altimas aka Greg Altimas

